Business Intelligence Reports & OLAP Dashboards
Bring Tally, SQL, Excel and Oracle data into one set of dashboards. Slice, dice and drill down sales, profit, stock and receivables by region, branch, product and customer, in SunTim's own BI tool, from any browser.
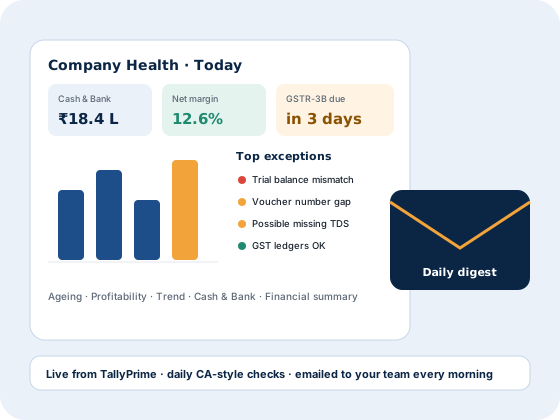
All your business data. One set of dashboards.
Accounts sit in Tally, orders in an SQL or Oracle database, and targets in Excel sheets, so owners wait for someone to merge them. We connect these sources, build OLAP cubes over them in our own BI tool and give you dashboards that answer questions in a click: which region, which branch, which product, which customer.
- Data from TallyPrime, SQL Server, MySQL, Excel and Oracle
- OLAP cubes: drill down, roll up, slice and dice
- Sales, profit, stock, receivables and GST dashboards
- Region, branch, product, customer and period views
- SunTim's own BI tool, in any browser and on mobile
- Scheduled data refresh from your systems
Data sources we connect
Tell us where your data lives.
Dashboards businesses use every day
Sales and profit
By month, region, branch, product and customer, with gross margin.
Receivables and cash
Outstanding by age and party, and collections against targets.
Stock and GST
Stock value, slow movers and GST summaries, straight from Tally.
Your sales command center, on the boardroom TV
The boss asks, the screen answers: India-wise sales for the month, then state, city and product geography. Tap a question below, click any state, or switch the product. Sample data. The dashboard below it shows the same tool with FY 2025-26 figures in ₹ lakh.

Good morning! Here's your sales overview across India for Oct 2026. What would you like to explore?
India Sales Overview
Sales by state (₹ Cr) · Oct 2026Loading map…
Brand-wise Performance
India · Oct 2026 · click a brand to map itQuick Insights
Next Steps
Sample data. Click a state for its cities, then a city for its brand mix. Map shows the official boundary of India.
Sales by month ₹ lakh
Sales by region ₹ lakh
Pivot: region × quarter ₹ lakh, darker = higher
- Drill down from India to state to city
- Roll up back to the total
- Slice by region, product or channel
- Dice by quarter in the pivot
Frequently asked questions
Which software do the dashboards run on?
On SunTim's own BI tool, built and supported by our team in Mumbai. It opens in any browser, on a laptop, tablet or phone.
What is an OLAP dashboard?
OLAP (online analytical processing) arranges your data into a cube of measures, such as sales or profit, and dimensions, such as period, region, product and customer. You can drill down from a total to the detail, roll up again, or slice the data by any dimension in a click.
Can you combine Tally with SQL, Excel and Oracle data?
Yes. We bring data from TallyPrime and your other systems into one model, so one dashboard can show, for example, Tally sales against Excel targets and Oracle orders.
Do we need to change how we use Tally?
No. Your team keeps working in Tally. The dashboards read the data from it.
Can I see the dashboards on mobile?
Yes. The dashboards open in any browser, on a laptop, tablet or phone.
How long does setup take?
It depends on the number of data sources and reports. After a short discovery call we share a plan and timeline.
Get a free Tally integration demo
Tell us which DMS, ERP or Tally product you need. We'll call you back the same working day.